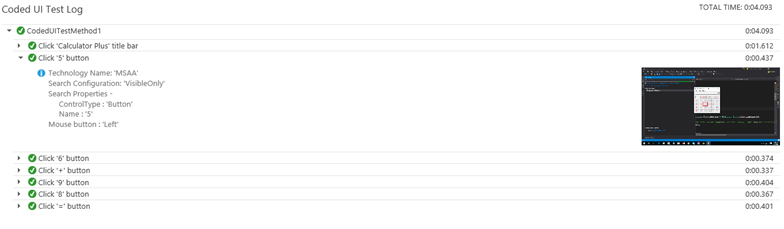
In this post we will discuss working with Drawhighlight method as well as diagnostics in Coded UI testing to generate HTML report as shown below.
Visual debug during playback
In coded UI testing we can set the diagnostics information for our code and we can get more information about the underlying code execution.
This we can obtain using a method called DrawHighlight
This will show a rectangular red color box in the control.
Problem with DrawHighlight()
The DrawHighlight() method is, it takes 7 seconds to complete its action, which incurs a slow performance over the period of time in you code execution.
And hence considered as a bad practice.
Diagnostics
Instead of DrawHighlight(), we can set Diagnostic levels.
This can be done by modifying the
QTAgent32.exe.config or
QTAgent32_40.exe.config
We can also add the same information of QTAgent into our project specific to app.config
The last option is by overriding the playback setting by adding the below LOC
Here is the complete video of the above discussion
Thanks for reading the post and watching the video !!!
Please leave your comments and let me know if there is anything I should update in this post.
Thanks,
Karthik KK